Field notes: watching the smoke cross the grid before the stations twitch
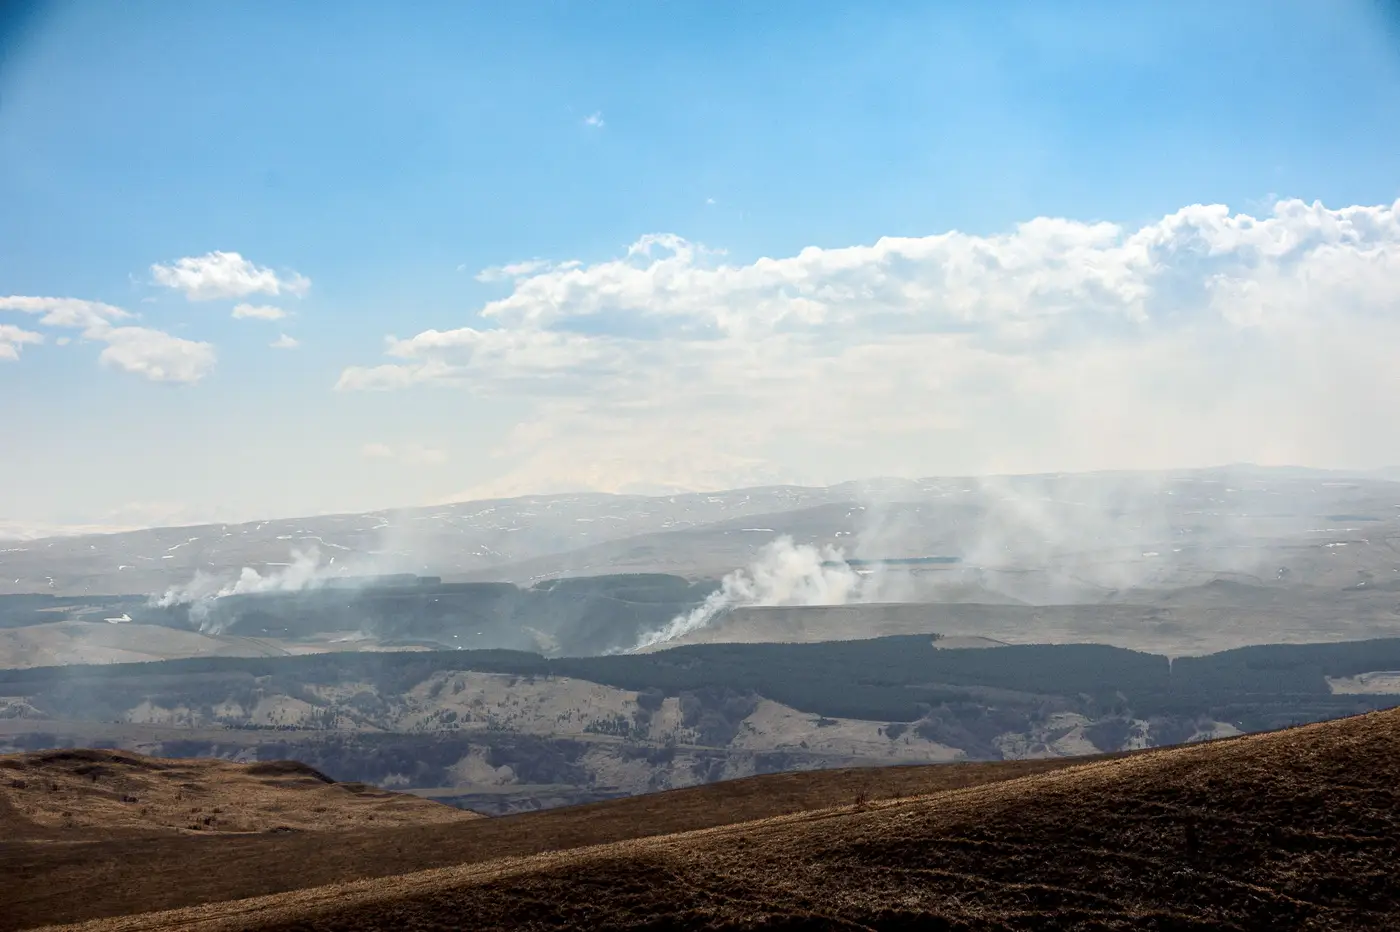
Day one of any smoke event, the fixed-station network is always a little late to the party. The instruments aren't the problem. Beta attenuation monitors and federal reference method samplers do exactly what they're built to do: measure the air directly over one point, continuously, with the kind of precision you can defend in a report. The problem is the points. A network built to track urban PM2.5 trends places stations where the population lives, and a plume crossing the domain on a given Tuesday rarely lines up with where that is.
This is the week I keep coming back to from last fire season. A transport plume moved off a fire complex two states upwind and started sliding across our monitoring domain on a quartering wind, the kind that doesn't respect county lines or station siting studies. The nearest downwind monitor sat sixty-some kilometers from the leading edge. By the time it registered anything above background, the plume had already been visible in the morning satellite pass for the better part of a day.
I'd pulled up the daily raster out of habit more than expectation, the way you check a weather radar loop even when the forecast says clear. And there it was: a long gray smear of elevated aerosol optical depth, tracking almost exactly along the 700 mb flow, with a density gradient that told you where the core of the plume sat versus the thinning edge. Coarse pixels, nothing you'd zoom into and read street names off of, but the shape was unmistakable. You learn to read these rasters the way you'd read a stain on a ceiling. The shape tells you where the water's coming from even if you can't see the pipe.
What the raster gave me that morning wasn't an exceedance call, since it can't make one at this resolution. We're north of 250 meters per pixel off a multispectral pass with one look a day, so it was never going to tell me what was happening at a specific intersection at 2pm. What it told me was which direction to point attention, which of our outlying monitors to start watching more closely, and roughly when the leading edge would reach them based on the overnight wind shift. It filled the gap between stations instead of waiting for one of them to confirm what the raster had already shown hours earlier. I started a note to the regional office a good twelve hours before the first station confirmed anything, and when the exceedance did hit, the public notification was already half-written.
There's a particular kind of calm in a smoke season that goes smoothly, and it has nothing to do with luck. It comes from having eyes on the space between your stations, because that's always where the surprise comes from. The monitors you've got measure their own patch of sky accurately and nothing past it. A plume moving at altitude over a few hundred kilometers of terrain crosses stretches of your domain that your siting plan never had a reason to cover, and that's exactly where it catches a network off guard.
I've stopped thinking of the daily raster as a secondary product I check when something feels off. It's part of the morning routine now, right alongside the AQI dashboard, mostly because it's the only thing in the stack that shows the in-between. A time series on a grid cell near your network boundary tells a different story than a station reading ever could, because it's been watching that patch of sky every day whether or not anything was happening there.
If your network has the same kind of dead zones ours does, the between-monitor view FlyPix AI built for exactly this gap is worth a look before the next complex starts producing smoke that outruns your siting plan.
Stay upwind.