Blog
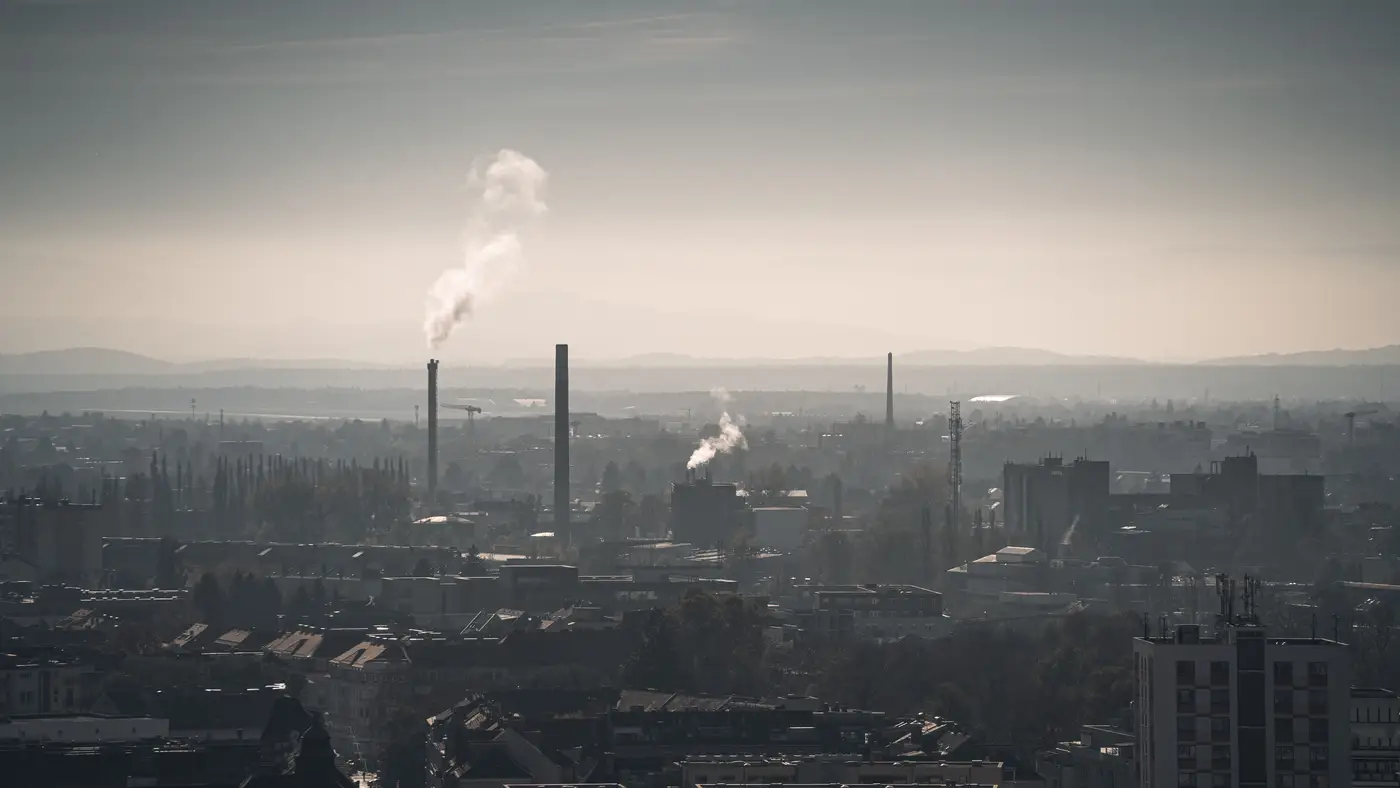 Field notes: the industrial corridor nobody put a monitor on
Three months of daily AOD rasters over a gap in the network, and what the haze band between two fixed stations really looked like.
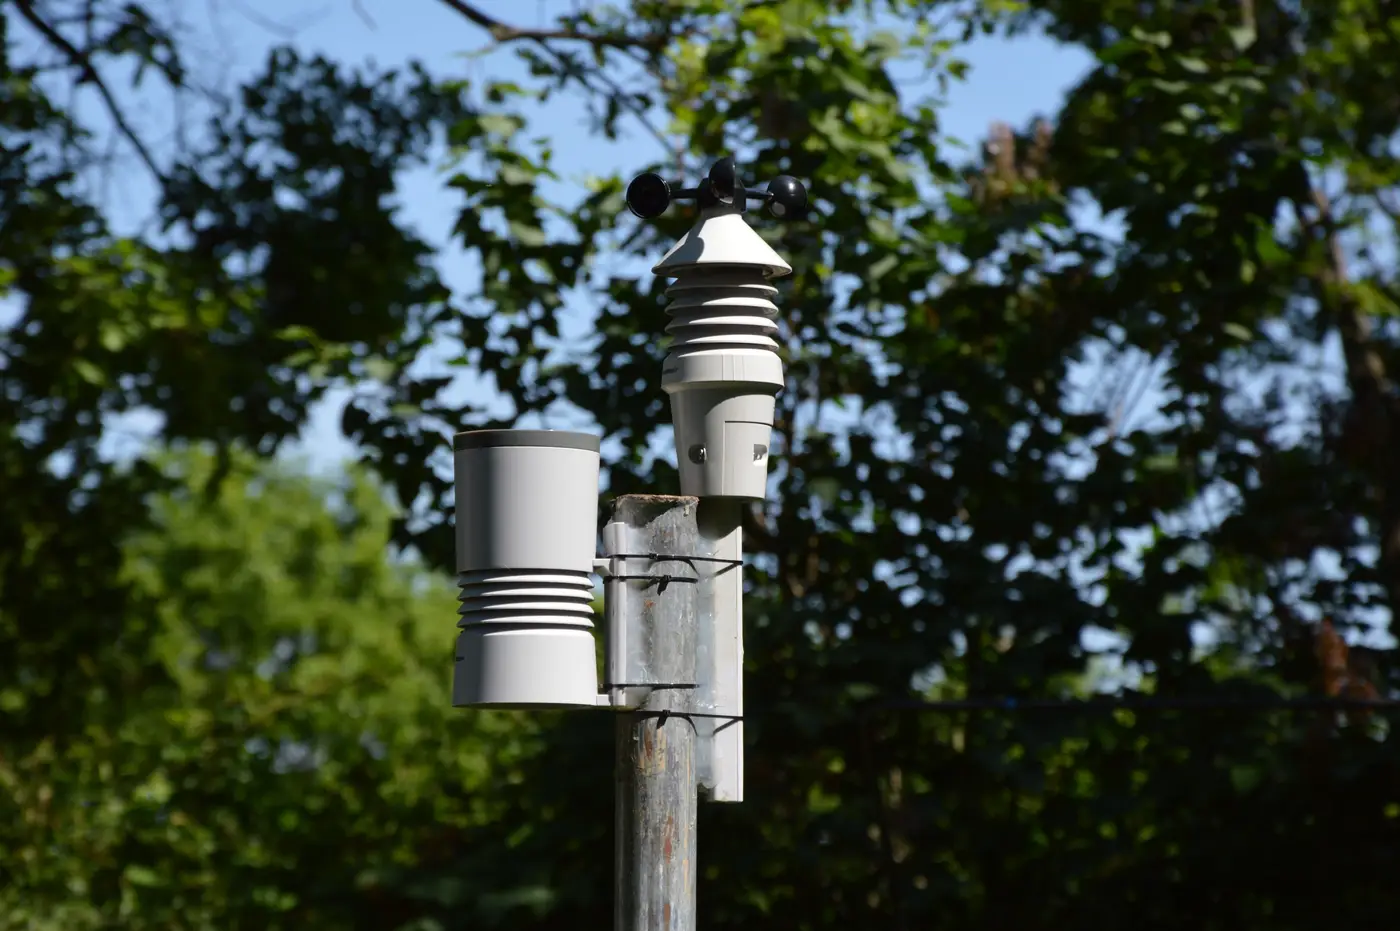 What is a representativeness radius, and why it shapes where you site a monitor
A plain look at monitor representativeness area, the scales of representativeness in siting criteria, and what happens in the space a station doesn't cover.
 Briefing a SIP team on a daily AOD raster
How to brief a SIP team on a daily AOD raster as supplemental, weight-of-evidence data between fixed monitors, not a monitor replacement.
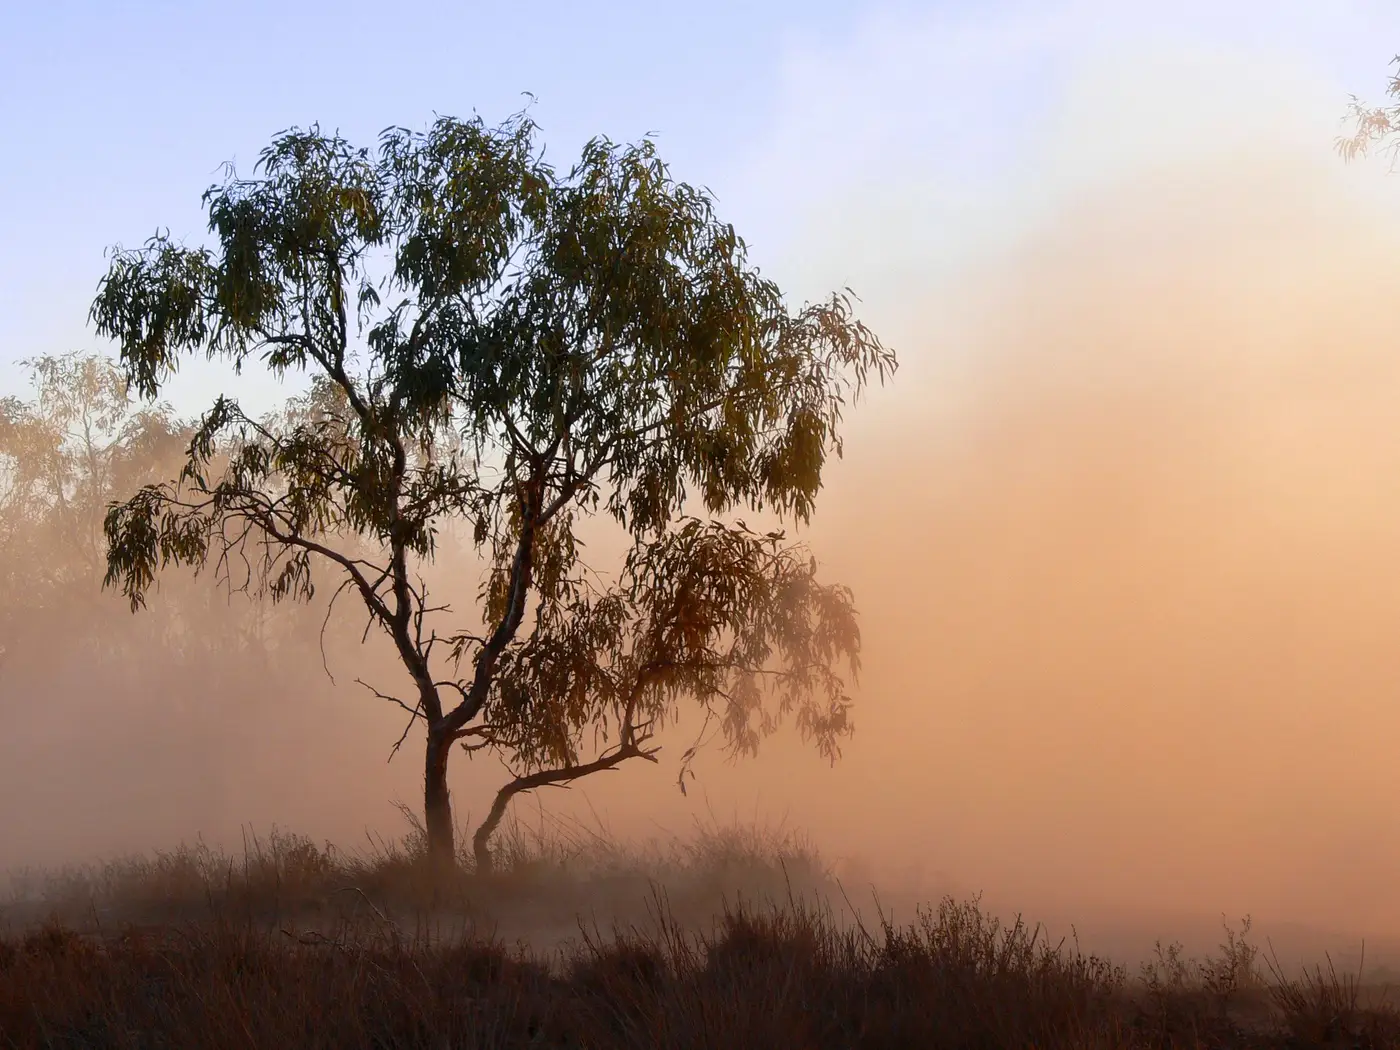 Clear-sky bias in satellite AOD, and why it skews a gap-fill analysis
Clear-sky bias in satellite AOD comes from cloud screening, and it can quietly skew a gap-fill analysis between monitors. Here's what to check for.
- Field notes: the week a Saharan dust plume painted the raster orange
A Saharan dust plume lit up the AOD raster for days while most PM2.5 monitors barely moved. Field notes on why, and what the gap looked like cell by cell.
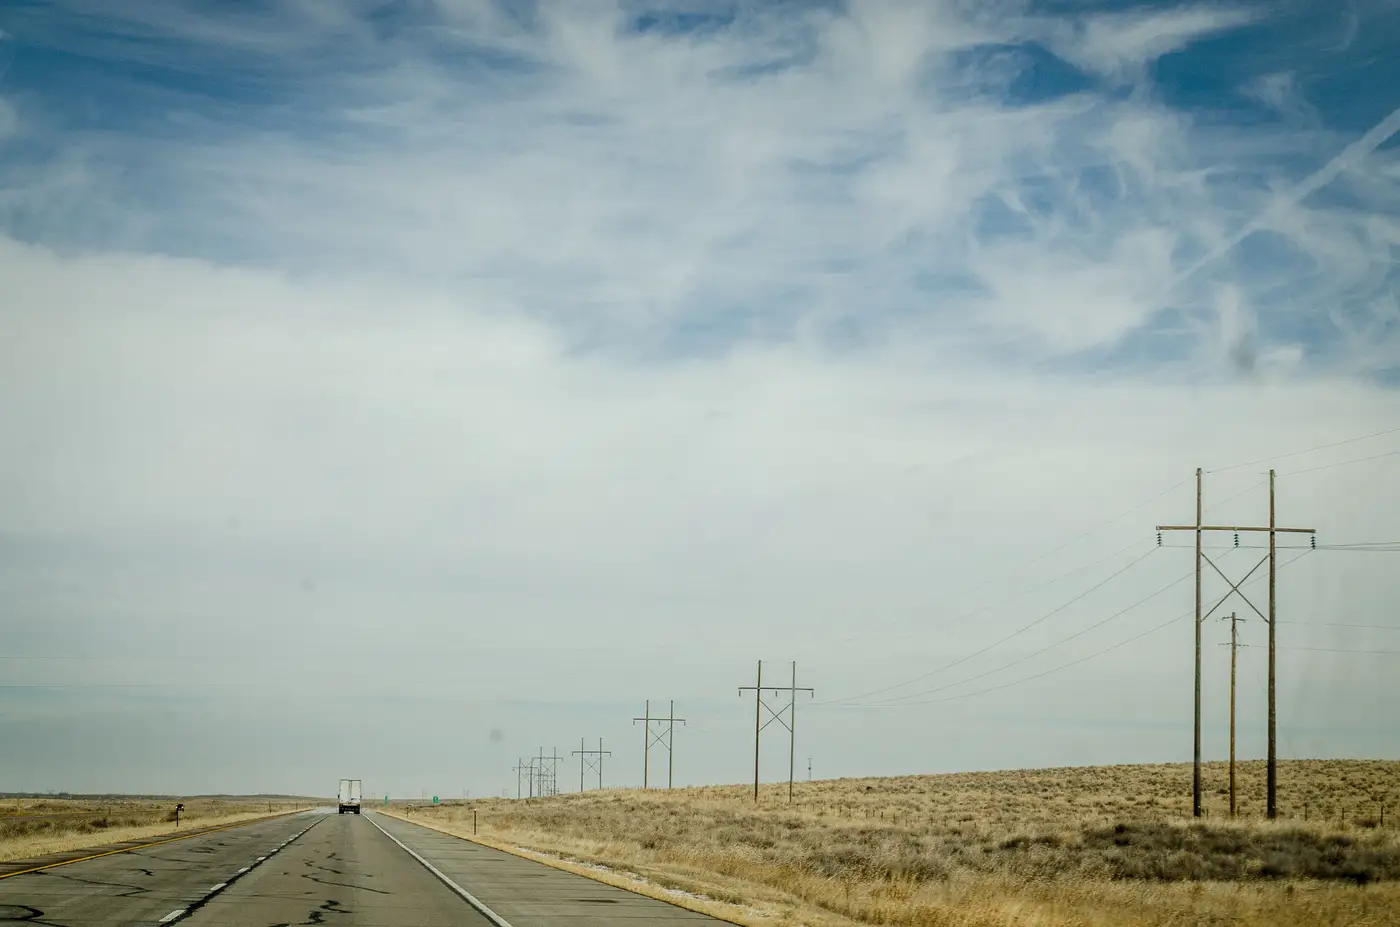 How to choose grid resolution for a daily AOD raster between fixed monitors
A practical guide to picking GeoTIFF grid cell size for a daily AOD proxy raster that fills gaps between fixed air-quality stations.
- How to write a 5-year ambient air monitoring network assessment
How to structure a 40 CFR 58.10 five-year network assessment, and how to write a defensible gap analysis for the space between your monitors.
- What is a special purpose monitor, and when do you deploy one?
What a special purpose monitor is, how it differs from SLAMS, and the siting and deployment criteria agencies use to decide when to run one.
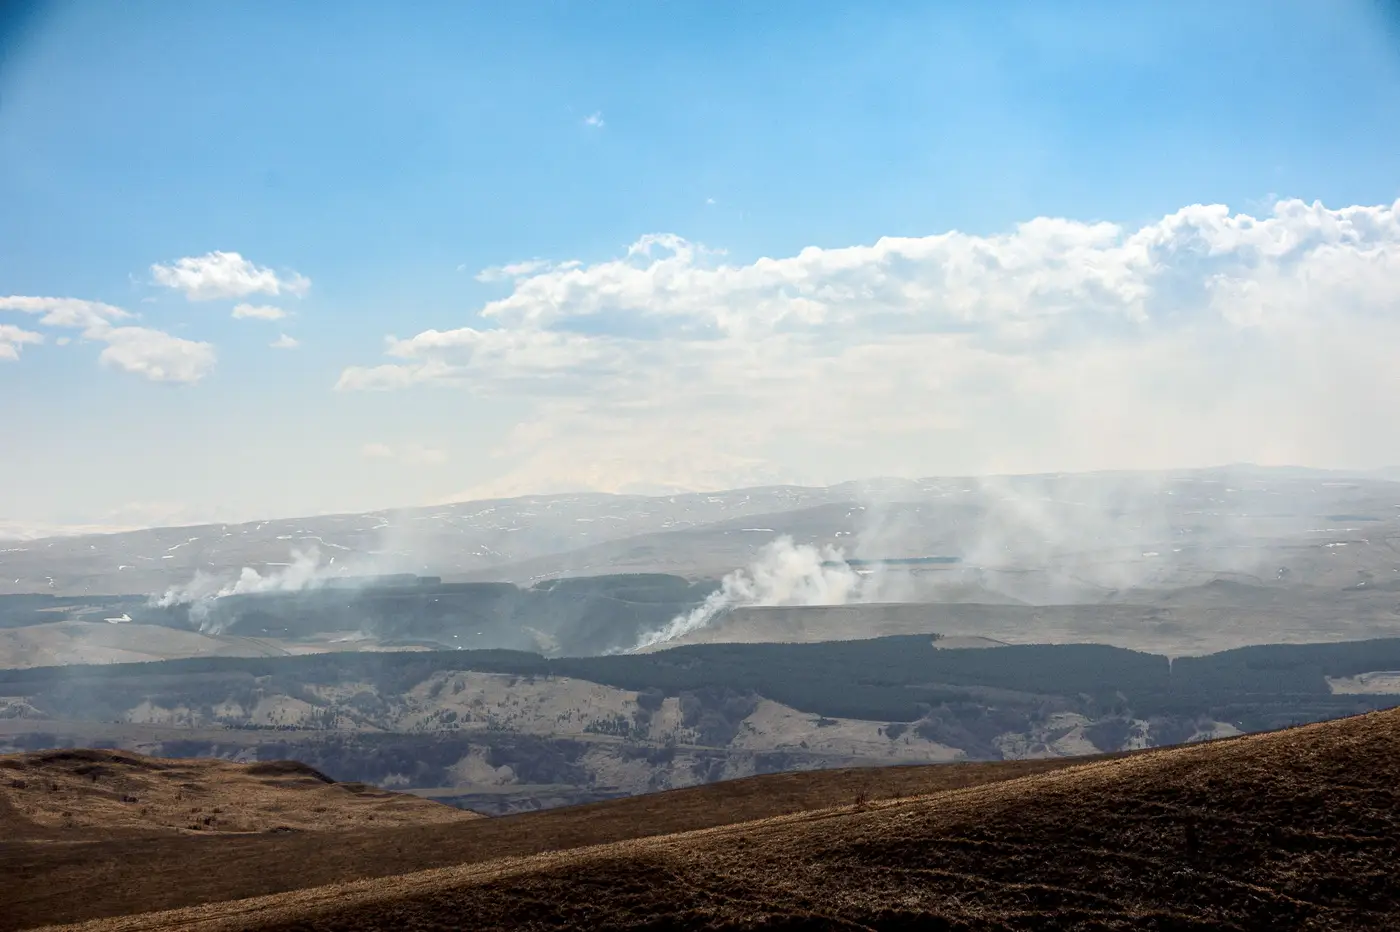 Field notes: watching the smoke cross the grid before the stations twitch
A wildfire-season field note on catching a smoke plume in a daily AOD raster hours before the fixed-station network registered it.
- What a GeoTIFF is, and why gridded AOD data ships in one
What a GeoTIFF actually contains, and why gridded AOD rasters in that format are easier to work into a monitoring-gap workflow than swath or point data.
- GeoTIFF vs NetCDF for gridded air quality data: which format fits your GIS
A practical comparison of GeoTIFF and NetCDF for delivering gridded AOD and other air quality rasters into an agency GIS workflow.
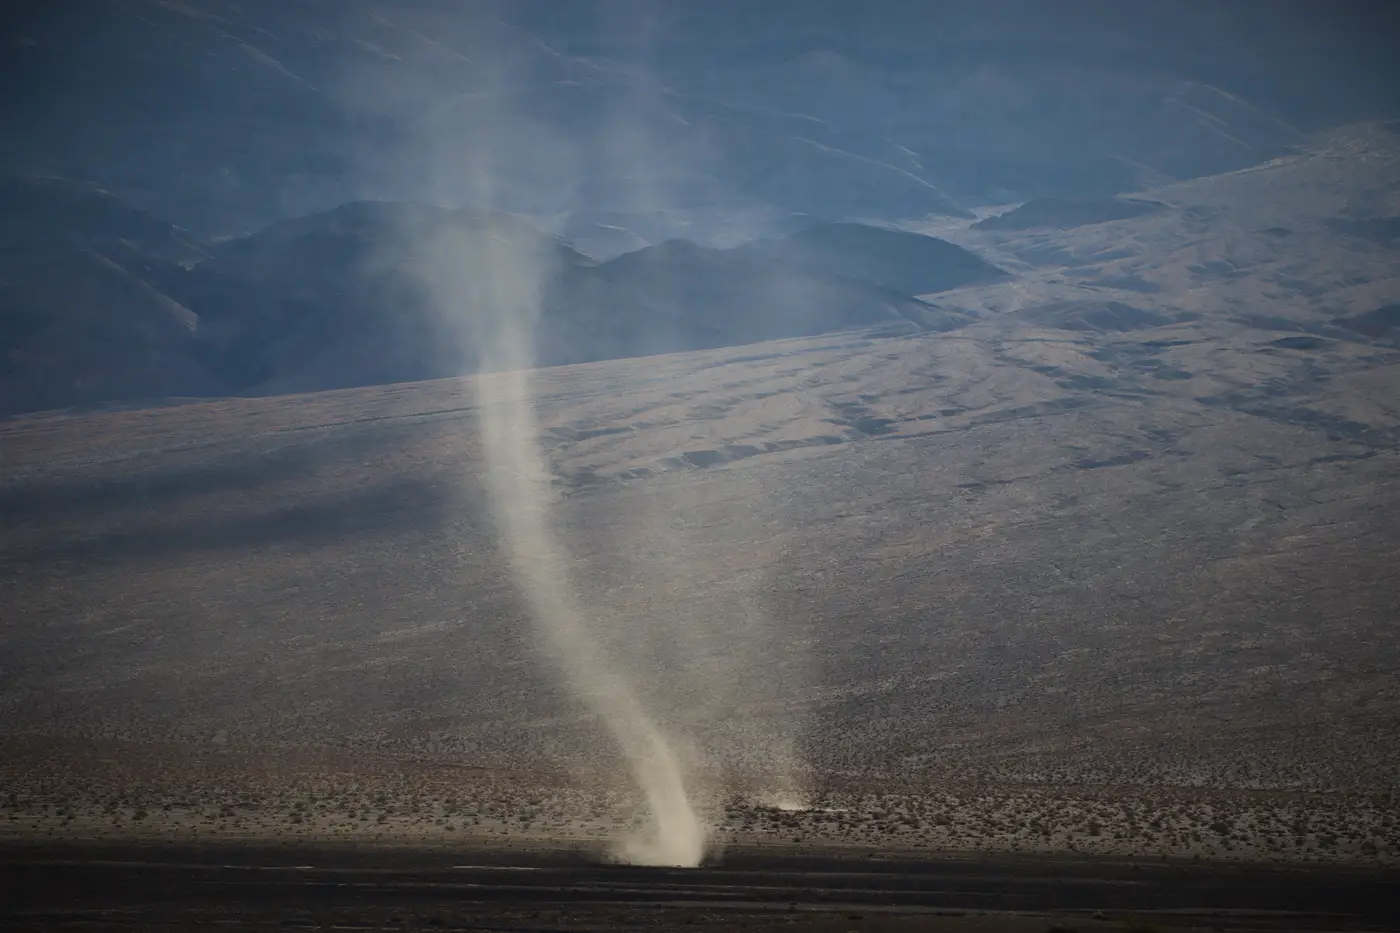 What is a natural events action plan? A plain guide for air quality analysts
What a Natural Events Action Plan is, how it fits under EPA's Exceptional Events Rule, and what documentation holds up for a NEAP dust exceedance.
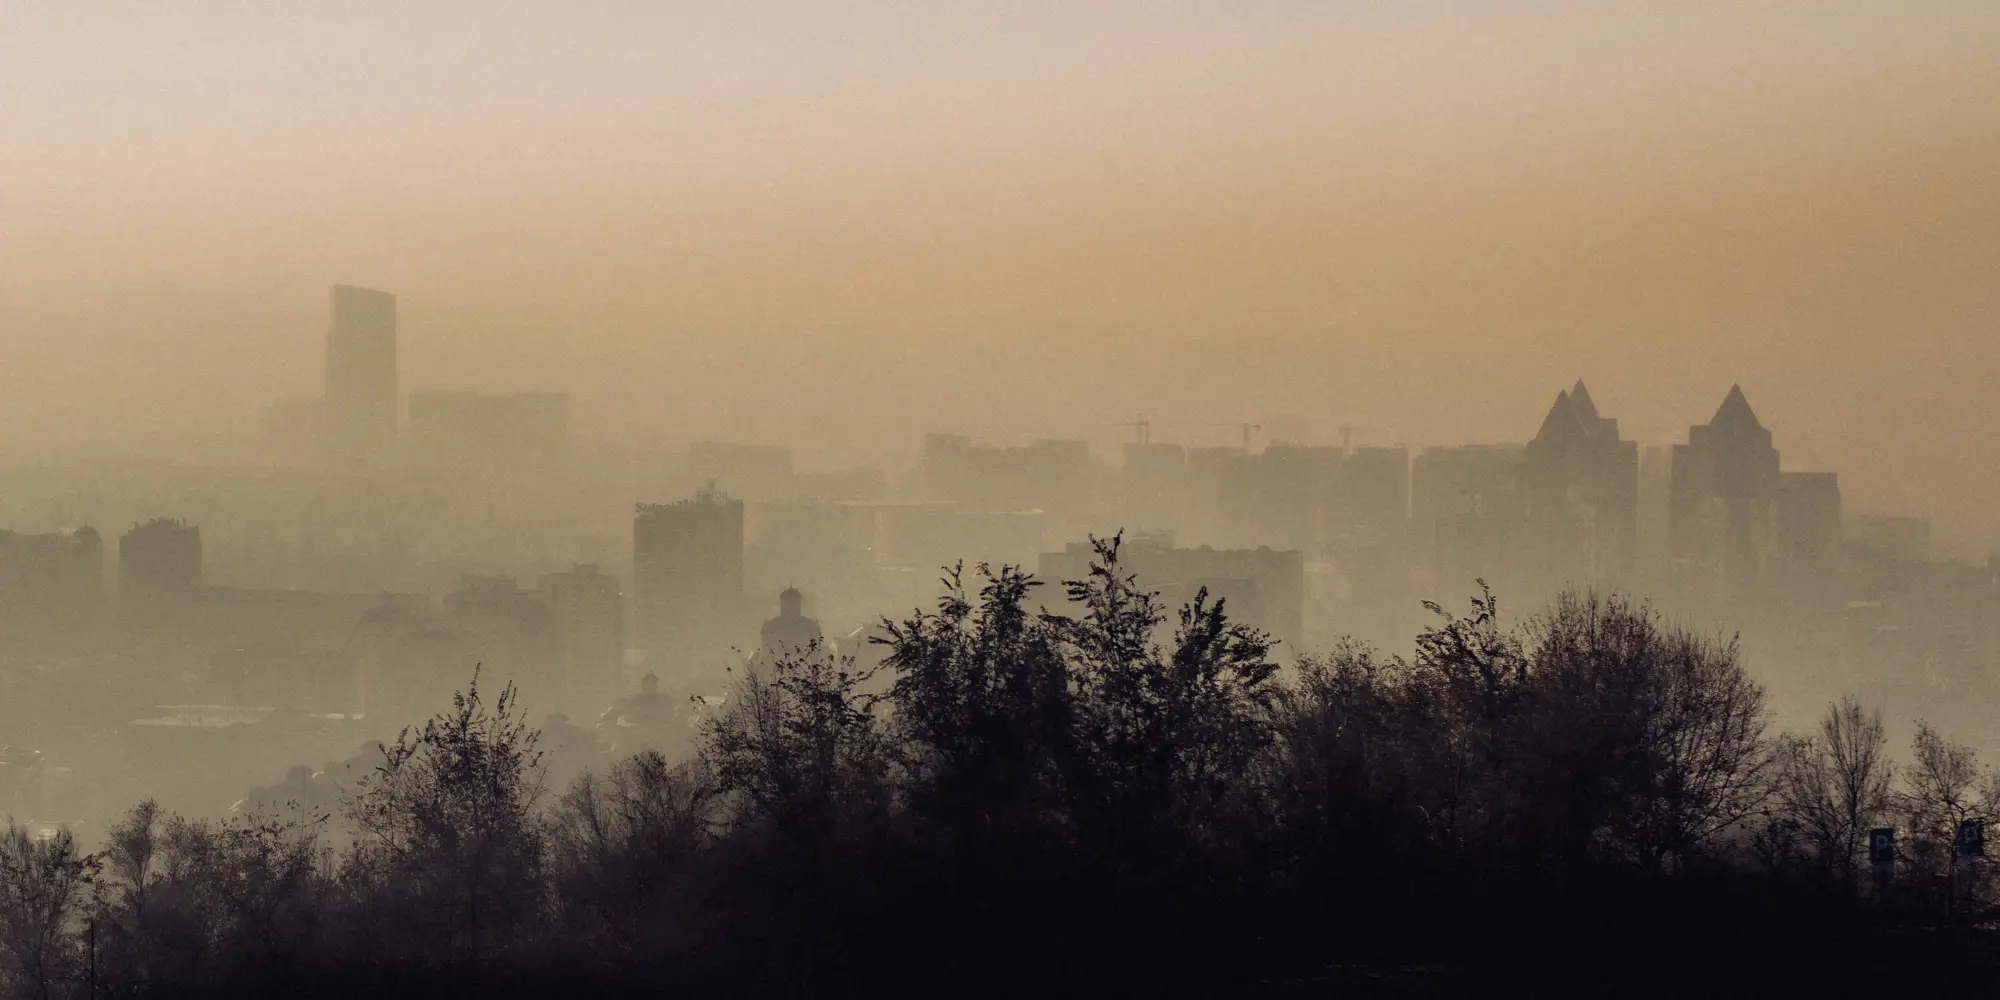 MODIS vs VIIRS AOD: which satellite product fits regional haze mapping
MODIS vs VIIRS AOD compared: sensor history, retrieval algorithms, resolution, and overpass timing for filling gaps between air-quality monitors.
- What is the Angstrom exponent in aerosol remote sensing?
A field explanation of the Angstrom exponent, why it separates fine-mode smoke from coarse-mode dust, and where the method breaks down.
- AOD to PM2.5 conversion explained: why column aerosol isn't surface concentration
What aerosol optical depth measures, why it doesn't equal PM2.5 at the ground, and how analysts actually use AOD between fixed monitoring stations.
- How to fill gaps between air quality monitoring stations
A look at spatial interpolation, dispersion modeling, and satellite AOD as ways to cover the space between fixed air quality monitors.
- Satellite AOD vs ground-based PM2.5 monitors: what each one actually measures
AOD from satellite passes and PM2.5 from a beta attenuation monitor answer different questions. Here's where each one is strong, and where it isn't.
- Siting criteria for ambient air quality monitors, and the gaps they still leave
A field guide to EPA Appendix E monitor siting rules, roadway-distance requirements, and why representativeness still leaves gaps between stations.