Field notes: the industrial corridor nobody put a monitor on
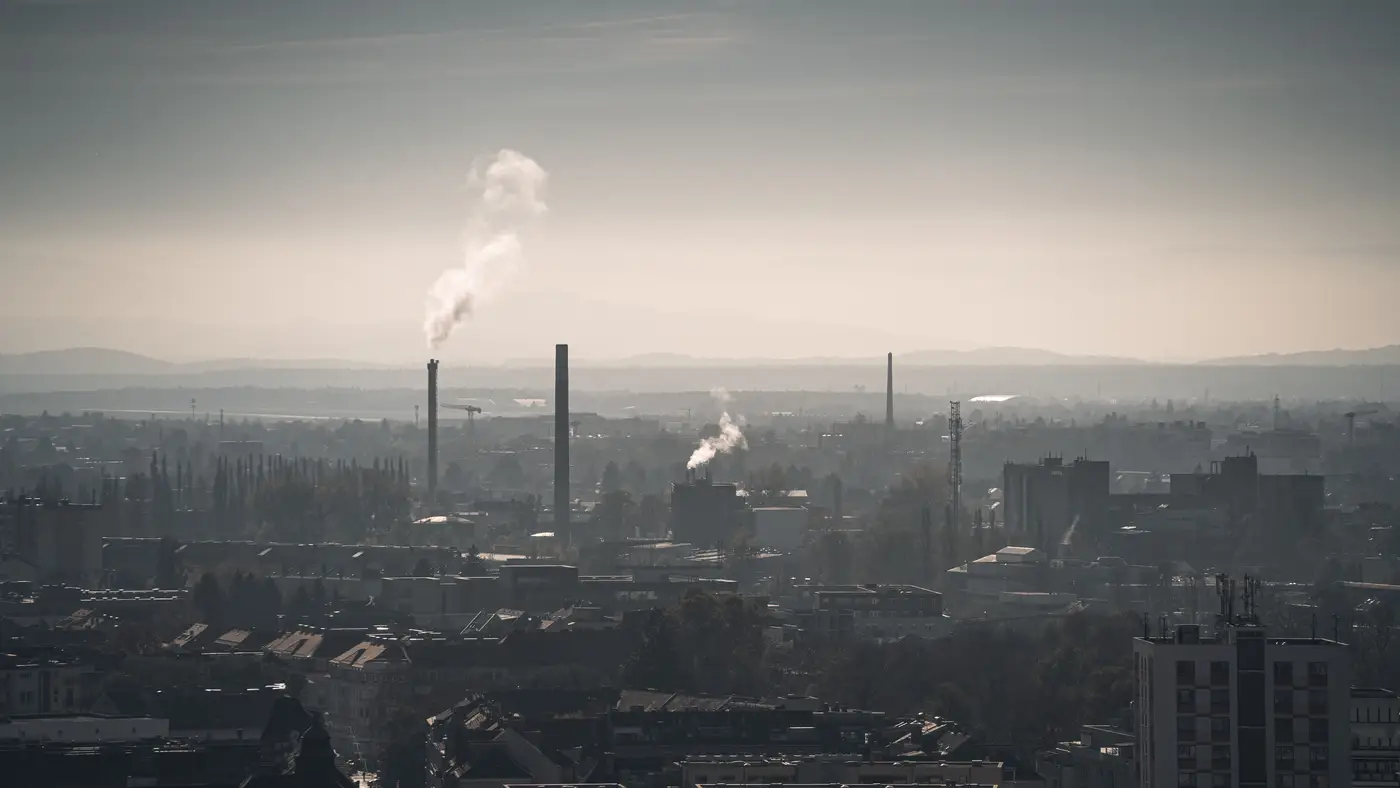
Every regional network has one of these. A stretch of rail yard, tank farm, and secondary road truck traffic that sits exactly between two siting decisions made a decade apart, neither of which had this corridor in mind. One station sits upwind, one sits twelve miles downwind near a school, and the forty-some miles in between are a blank spot on the siting map. Nobody built the case for a monitor there. The land use shifted after the stations went in, the way it always does, and now you've got a working industrial strip with no instrument anywhere near it.
I've spent three months watching that kind of gap through daily rasters instead of a gauge, and the pattern that showed up isn't dramatic so much as it is consistent, which is its own kind of interesting.
The first thing you notice is that the band doesn't sit still. On a still, cool morning the raster shows a tight, dark ribbon hugging the rail siding and the row of storage tanks, barely wider than the facility footprint itself. By early afternoon, once the ground has warmed and the mixing layer has lifted, that same ribbon spreads out across two, sometimes three grid cells to the east. It's the same source, but the footprint on paper roughly triples between 7am and 2pm. If your only anchor points are the two bracketing stations, you'd never see that breathing in and out. You'd see a flat daily average that hides the whole shape of the event.
The second thing, and the one that made me go back and re-check the raster against the dates, is how often the corridor lit up on days when both bracketing stations read clean. Out of the full quarter, there were nine days where the upwind and downwind stations both came in well under their respective thresholds, and the grid cells sitting directly over the corridor itself showed a clear bump. Low pressure, light wind, a stalled front sitting just offshore. The stations fifteen miles apart were each, correctly, reporting their own air. Neither was wrong. They just weren't standing where the haze was that day.
None of this tells you a number you can cite in an enforcement letter. A coarse-resolution AOD raster gridded at a few hundred meters isn't going to resolve a single stack plume or hand you a concentration you can defend in front of a hearing officer. What it does is show you, every single day for a season, where the column of haze sat relative to your fixed instruments, and whether the gap between them was actually empty or just unmonitored. Those are different things, and this quarter made the difference pretty obvious.
What I'd use this for, going forward, is the siting conversation itself. Three months of daily grids over a corridor is a much better argument for a temporary monitor, or for moving a mobile unit for a two-week intensive, than a hunch and a wind rose. You can point at the specific days the band sat heaviest and ask the obvious question: were the two permanent stations, that morning, telling you anything about what was happening in between them?
If you're running the same kind of gap in your own network, a daily raster and a per-cell time series over your draw area is the whole offer at the Air Quality Proxy landing page, and it's built for exactly this kind of before-the-next-station-goes-in question.
Pull three months over your own corridor and see what the gap really looks like.