Field notes: the week a Saharan dust plume painted the raster orange
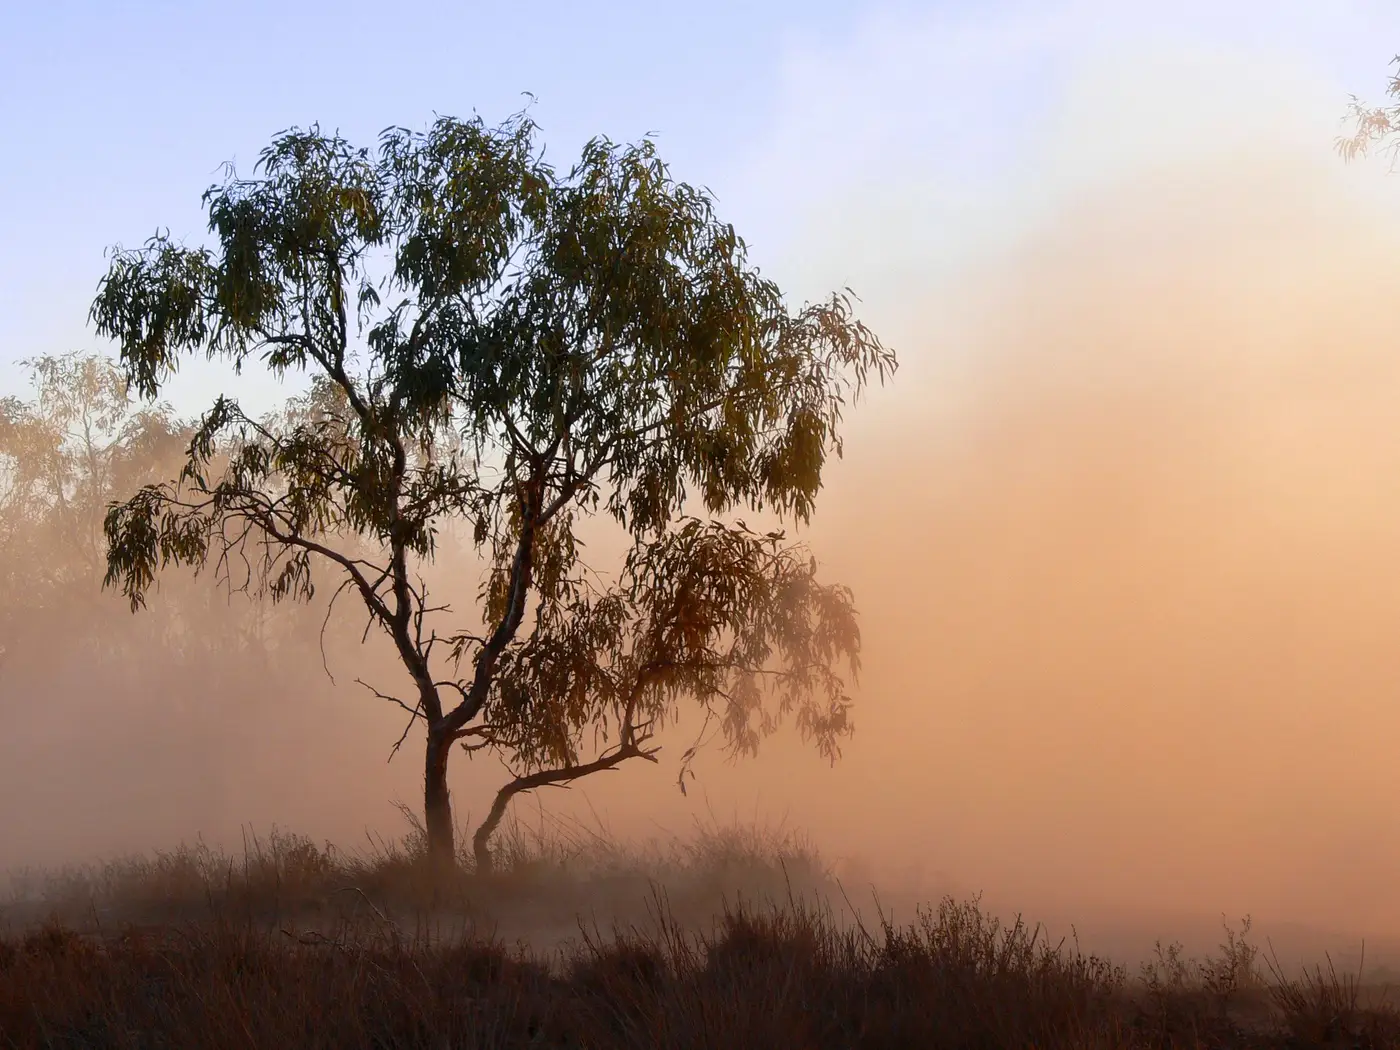
The dust showed up on a Tuesday, the way it usually does this time of year: a long tongue of Saharan air dragged north over the Atlantic, swinging east on the upper-level flow, and settling over the region sometime after midnight. By the time the morning raster came in, the whole western half of the grid had gone the color analysts dread and sort of love at the same time. Deep orange, AOD pushing past 1.0 in the hot spots, a gradient bleeding east across three grid cells a day like a bruise spreading.
The ground network said almost nothing.
Two of the five PM2.5 monitors in range ticked up, modestly, the kind of bump you'd otherwise chalk up to a stagnant morning or a neighbor running a mower too long. The other three sat flat. If you were watching only the fixed stations that week, you'd have filed it as an unremarkable Tuesday. The raster was telling a completely different story, and that gap is the whole reason this job exists.
Why dust and PM2.5 disagree
This isn't a bug in either dataset. AOD is a column measurement: it integrates every particle between the satellite and the ground, dust included, and Saharan dust tends to loft well above the boundary layer, sometimes riding at two or three kilometers before it mixes down, if it mixes down at all. A monitor at two meters only sees what's actually landed in the air it's sampling. A plume can sit directly overhead, fat and visible from space, and still leave the surface instrument nearly untouched for a day or two while it works its way down through the atmosphere.
Composition matters too. Coarse mineral dust reads heavy in optical depth because it scatters light efficiently across a wide size range, but a lot of that mass sits above 2.5 microns and never gets counted in a PM2.5 number at all. So you can have a legitimately hazy, visibility-reducing event, confirmed by every satellite pass and reported by pilots and the odd person complaining about the sunset color, that your regulatory monitors shrug off entirely because they're tuned to a different size fraction.
What the raster caught that the stations missed
The three days before the plume peaked told us more than the peak itself did. The leading edge was still out over open water on day one, and the eastern monitors hadn't registered a thing. By day two the gradient had moved roughly a hundred kilometers inland, visible cell by cell in the time series, with enough lead time to flag the event internally before anyone's phone started ringing about haze near the coast. That's the between-monitor work a sparse station network can't do on its own, no matter how well the individual instruments are calibrated: it can tell you what's happening at five points, not what's moving through the other four thousand square kilometers in between.
By Friday the plume had mostly cleared east, AOD back under 0.2 across the grid, and the two monitors that had bumped settled back down with it. Nothing in the regulatory record will ever show this as an exceedance. It probably shouldn't. But anyone filling in the narrative for the week, or fielding the inevitable "why does the air look orange but the monitor says we're fine" question, had a raster to point to that explained exactly where the dust was and when it arrived, cell by cell, well before the ground network caught up.
That's the gap a daily aerosol raster is built to sit in: not replacing the fixed stations, just showing you what's drifting through the space between them. If your network has the same blind spots, a daily regional raster like this one is worth a look for the next time the sky does something the monitors can't explain.