Briefing a SIP team on a daily AOD raster
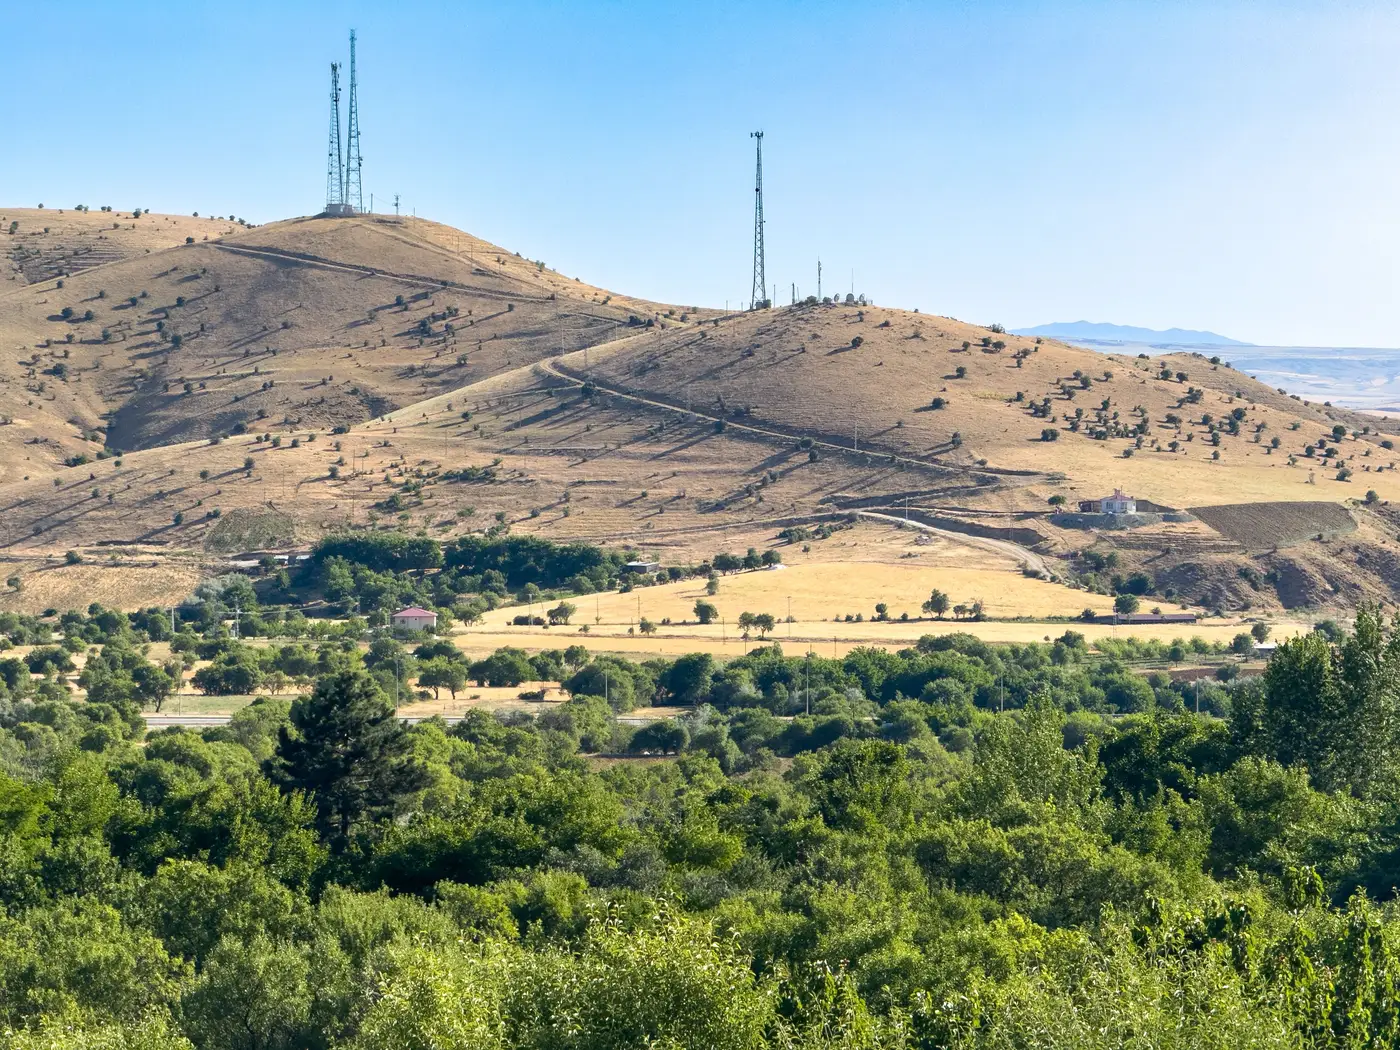
If you've sat in a SIP planning meeting and watched someone ask "what's happening between Monitor 12 and Monitor 19 on the day of that exceedance," you already know the gap this is about. Fixed stations tell you a lot at a point. They tell you nothing in between unless you build a case for it, and building that case is most of the work in a State Implementation Plan package.
What a daily AOD raster actually gives you
Aerosol optical depth is a column measurement, not a surface reading. A coarse-resolution multispectral satellite pass estimates how much light is being scattered or absorbed by particles in the full air column above a grid cell, at roughly 250 meters or coarser per cell, once a day. That is not the same number your FRM monitor reports, and it should never be presented as if it were. What it gives you is a spatial picture: a raster over your whole region, plus a time-series CSV per grid cell, showing where haze is thickening or thinning on days your stations can't see directly because there's no instrument sitting there.
For SIP work this matters most in the stretches between stations, the parts of a nonattainment area where a transport event, a wildfire plume, or a regional haze episode might be building before it ever reaches a monitor that can log it as an exceedance. The raster doesn't log an exceedance either. It shows you the pattern forming, which is a different and more limited claim, and one worth being precise about when you're the one standing in front of the team explaining it.
Where this sits in a weight-of-evidence package
SIP demonstrations, especially exceptional events submissions and nonattainment boundary justifications, are built on corroborating lines of evidence by design. EPA reviewers want a narrative where the monitor record, the meteorology, the fire or dust source data, back trajectories, and any supplemental spatial data all point the same direction. A daily AOD layer fits as one of those lines, not as the anchor. Its job is to corroborate what the monitors and the met data are already telling you, filling in the geography between stations so the narrative doesn't have a hole in it on the map.
That's the frame to bring into the room: this is supplemental monitoring data for SIP purposes, not a substitute measurement. Say that out loud before anyone else has to ask.
Briefing the team without overselling the layer
When you present the raster to the SIP team, modelers, attorneys, your EPA regional liaison, whoever's in the room, lead with what it's built from and what it isn't. Coarse-resolution satellite pass, daily refresh, column aerosol loading rather than surface concentration. Then show the time-series CSV for the grid cells nearest the monitors in question, so the team can see how the satellite-derived signal tracks against the station record over the exact days under review. If the pattern lines up with what the monitors and the trajectory analysis already show, you've got another thread in the rope. If it doesn't line up, that's worth knowing too, and worth saying plainly rather than quietly leaving out of the briefing.
Avoid handing over the raster as a standalone exhibit. Pair it with the narrative every time: here's the monitor exceedance, here's the fire detection, here's the trajectory, and here's the AOD pattern showing the plume moving through the gap between Station A and Station B on the same day. That's a weight-of-evidence argument. A raster by itself, with no context, is just a picture.
One more thing worth saying directly to your team before anyone cites this in a submission: coarse-resolution satellite AOD has known limits over bright surfaces, cloud cover, and complex terrain, and it hasn't been through the kind of local calibration your FRM network has. None of that disqualifies it from a supplemental role. It just means the caveat belongs in the briefing, not buried in a footnote someone finds later.
Air Quality Proxy builds exactly this layer, a daily AOD raster gridded over your region and delivered as GeoTIFF plus a per-cell time-series CSV, meant to sit alongside your station network rather than stand in for it. If your next SIP package needs that gap filled, take a look at what it delivers.