MODIS vs VIIRS AOD: which satellite product fits regional haze mapping
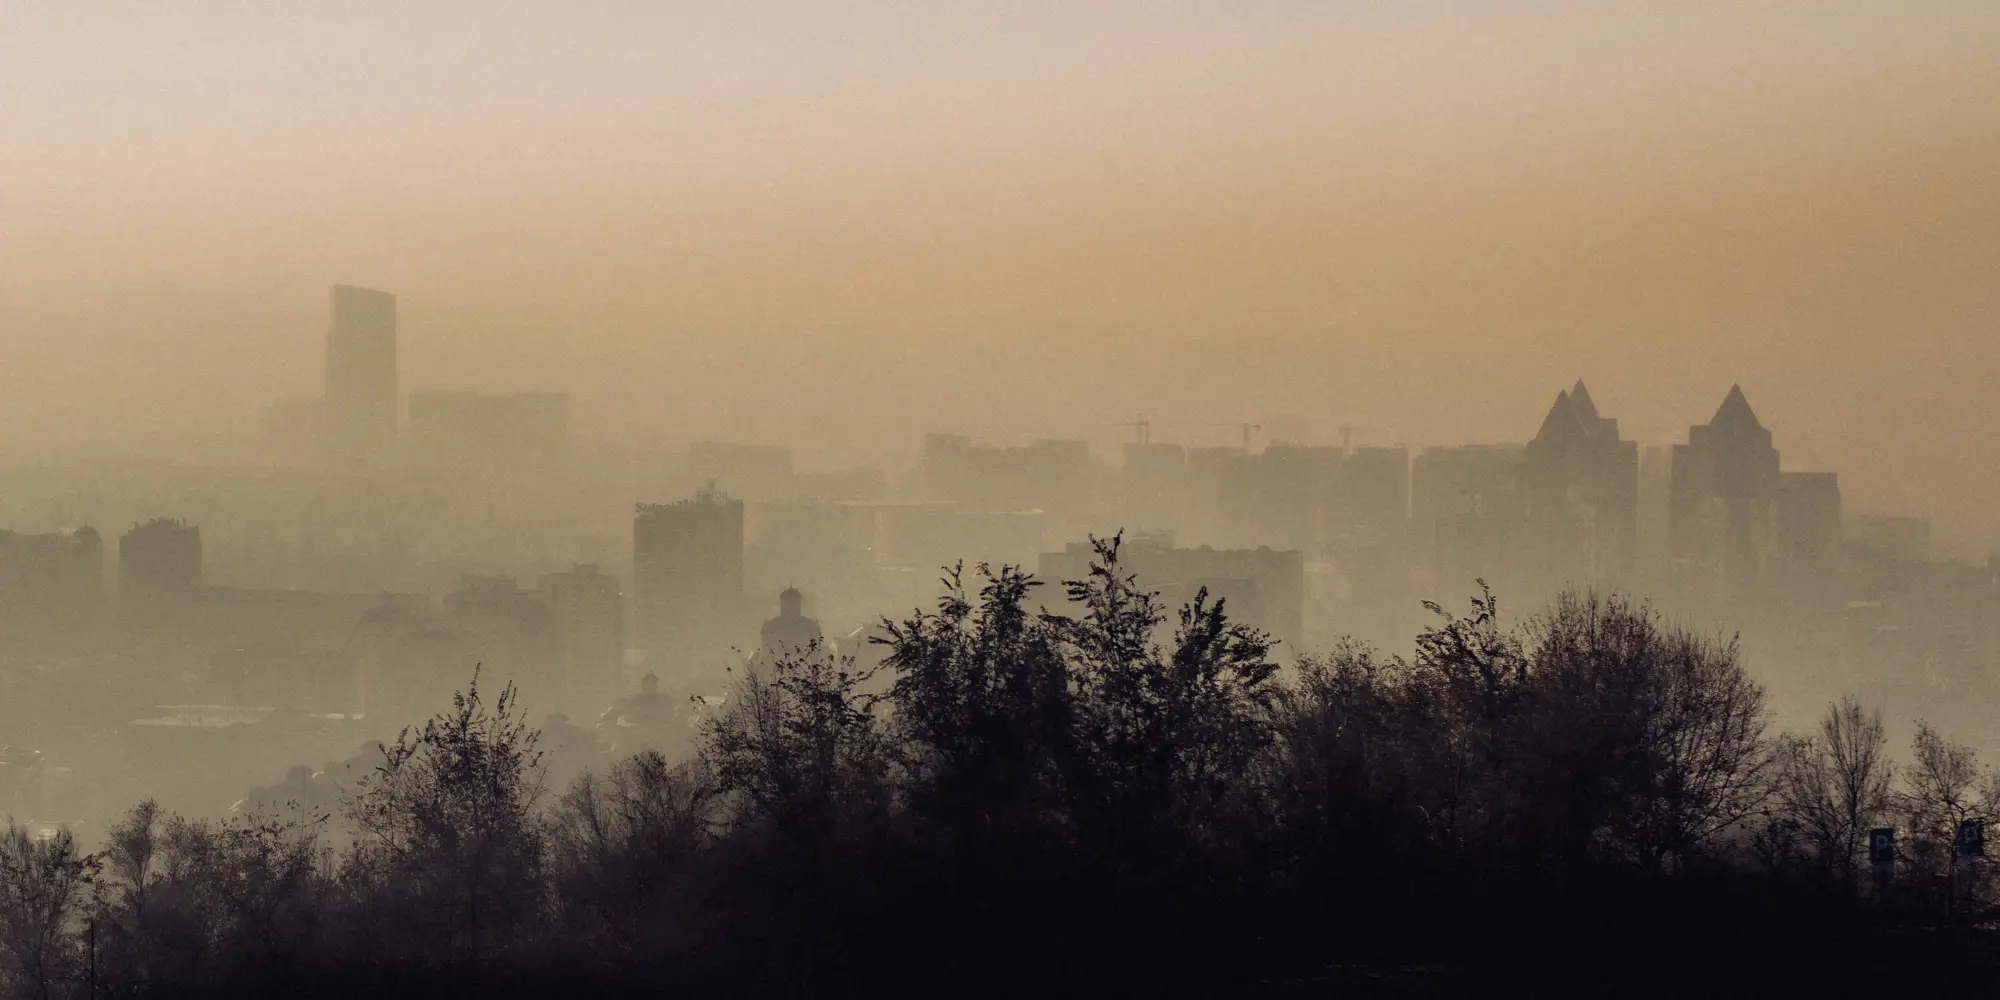
If you've spent any time pulling AOD into a GIS to backfill a gap in the monitoring network, you've run into both of these products and probably wondered which one to trust for a given stretch of coastline or valley. MODIS and VIIRS aren't interchangeable, even though they get lumped together in a lot of agency guidance docs. Here's how they differ when you're trying to catch a haze event between stations rather than just cite a column value in a report.
Where each sensor comes from
MODIS flies on Terra and Aqua, both well past their original design life at this point, with a continuous aerosol record going back to 2000. That length of record is the whole reason MODIS still shows up in trend analyses and long-term exceedance studies. The downside is that Terra and Aqua are aging hardware, and NASA has been open about declining instrument health affecting some bands.
VIIRS is the operational continuation, flying on Suomi NPP and NOAA-20 as part of the JPSS program. It's the planned replacement for MODIS, which matters if you're building a monitoring workflow you expect to still run in five years. NOAA and NASA both publish VIIRS aerosol products, and the two agencies don't always process them the same way, so check which version a given data provider is pulling before you compare two days side by side.
Resolution, retrieval algorithm, and what that means for your grid
MODIS AOD comes out of two retrieval algorithms, Dark Target and Deep Blue, stitched into a combined product. Dark Target handles AOD over dark surfaces like vegetation and ocean well; Deep Blue was built to recover a signal over bright surfaces like desert and urban concrete where Dark Target struggles. If your region has mixed land cover, the combined product is doing some algorithm-switching under the hood that's worth knowing about when a pixel looks off.
VIIRS has a finer native pixel than classic MODIS output, which sounds like a win for regional haze mapping until you look at what the operational aerosol EDR product delivers after aggregation. The raw improvement in sensor resolution doesn't always translate one-for-one into a sharper gridded product by the time it's processed and quality-flagged. Both products end up coarse by ground-monitor standards, somewhere in the hundreds-of-meters-to-kilometers range depending on which version you pull, which is exactly why neither one is a monitor replacement. Treat them as a proxy that tells you where a plume is forming, not a number you'd cite in a compliance report.
Overpass timing and the gap it leaves
This is the part that trips people up on actual haze events. MODIS and VIIRS are both polar-orbiting, so each sensor gives you roughly one or two daytime passes over a given spot, not continuous coverage. A fast-forming smoke plume or a dust event that spikes and clears in a six-hour window can show up on one overpass and be gone by the next satellite's pass. If you're trying to explain why a station caught an exceedance that the gridded AOD "missed," check the overpass time against the station's hourly data before assuming the product failed. More often it's a timing gap, not a retrieval error.
So which one for regional haze mapping
For continuity with a decade-plus baseline, MODIS still has the longer record. For an operational product you can expect to keep running as Terra and Aqua wind down, VIIRS is the one with a future. A lot of state and tribal air programs are already leaning on VIIRS for exactly that reason, treating MODIS as the historical reference and VIIRS as the forward-looking feed.
Either way, raw swath data from either sensor needs cloud-masking, quality-flag filtering, and regridding before it's usable next to your station network, and that processing step is where a lot of in-house workflows quietly eat a day per week. If you'd rather skip straight to a daily gridded raster over your region, built from coarse-resolution multispectral passes and delivered as GeoTIFF with a per-cell time series, Air Quality Proxy does that part so your team can spend the time on the gap it's trying to fill, not the preprocessing.
Pull a sample grid over your region and see where the haze is forming before the next station catches it.