What is a representativeness radius, and why it shapes where you site a monitor
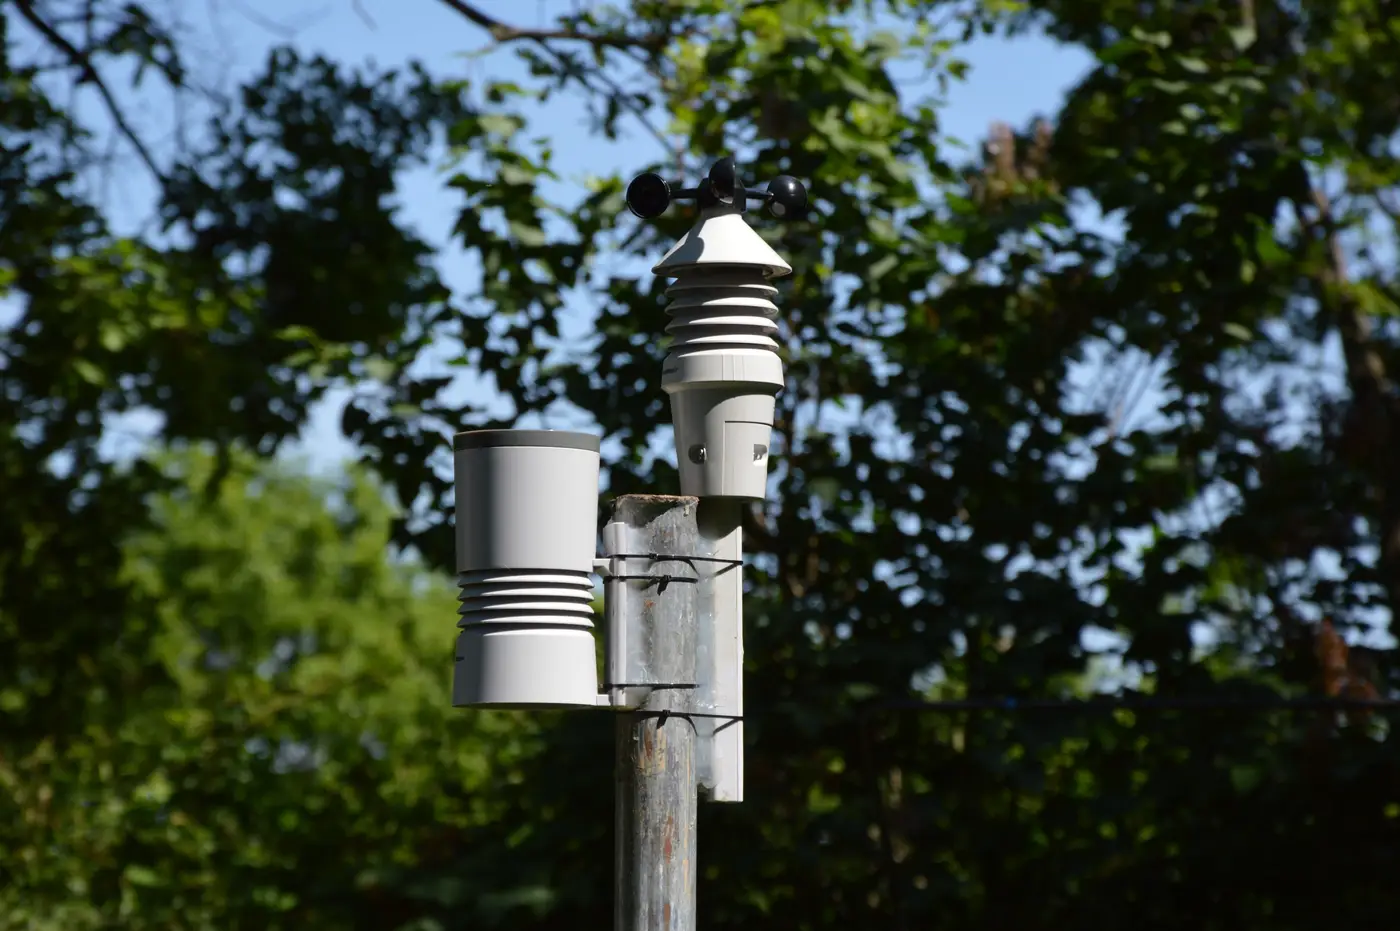
Every FRM or FEM monitor you site comes with an assumption baked in: that the air at the inlet is a decent stand-in for the air breathed across some surrounding area. That assumed footprint is the representativeness radius, and it's the first thing a reviewer checks when a siting package crosses their desk, right alongside probe height and distance from obstructions.
The term gets thrown around loosely, but it has a specific meaning in network design. A monitor's representativeness area is the zone within which pollutant concentrations are expected to stay close enough to what the monitor reads that you could use that reading to characterize exposure, track a NAAQS exceedance, or justify (or challenge) a permit decision for the whole area, not just the ten square meters around the shelter.
The scales, and why your monitor only covers one
Siting guidance breaks representativeness into a handful of spatial scales: microscale (the curb-side footprint near a single busy intersection, tens of meters), middle, neighborhood, urban, and regional, where one rural monitor can stand in for conditions across a multi-county airshed. Which tier a given site is built for depends on the question it's meant to answer. A near-road monitor sited at the microscale tier is doing its job even if it says nothing about the neighborhood three blocks over, and a monitor built for the neighborhood tier is useless for characterizing the hot spot next to a loading dock.
This is where a lot of siting disputes actually live. Someone looks at a monitor on a map, assumes it's telling them something about a 10-mile radius, and builds a permit argument or a health claim on top of that assumption. The monitor was never scoped for that job. Pull the siting rationale and you'll usually find a stated representativeness area a fraction of the size people assume from the dot on the map.
Where the gaps actually sit
None of this is really about any one monitor. It's about the space between them. Two neighborhood-scale stations twelve miles apart each have a defensible representativeness radius on paper, and the area between those radii is, by definition, not represented by either one. That's not a flaw in the network; it's the tradeoff you make when budget caps the number of stations you can staff and calibrate. But it means a haze event that forms and clears in the gap, a wildfire plume edge, a temperature-inversion buildup over a valley floor, can come and go without either station logging anything unusual, because it never crossed into either monitor's footprint.
Analysts dealing with this tend to reach for one of two things: a denser monitor network (rarely funded) or some kind of continuous spatial layer that at least flags where something is building, even coarsely, so a mobile unit or a QA check can follow up. That second option is closer to what a daily aerosol optical depth raster gives you. It won't replace an FRM reading and it isn't trying to; a coarse-resolution satellite pass can't give you the regulatory-grade number a reference monitor produces. What it can do is show you, grid cell by grid cell, where haze is thickening in the territory between your fixed stations, the exact ground your siting documents already admit isn't covered. If you want to see what that layer looks like for your own region, the Air Quality Proxy approach to filling those gaps is worth a look.
Representativeness radius matters because it's an honest admission that a monitor's reading has limits, and a good network design respects those limits instead of stretching one reading to cover ground it was never sited to cover. What matters for your network is what you're doing about the territory your siting criteria already told you they don't see, the space between representativeness radii where an event can build and clear before any station logs it.
If an event is building in that gap right now, a daily AOD raster is one way to catch it before the next station does.